- January 4, 2022
- Posted by: admin
- Category: Data Science

Things to know before starting with SHAP
What is Explainable AI (XAI)
By definition,
Explainable AI (XAI) refers to methods and techniques in the application of artificial intelligence technology (AI) such that the results of the solution can be understood by humans
Explainable AI helps in justifying why a model has made a particular choice. It makes the decision transparent by providing explanations that can be understood by non-experts.
Why XAI?
Business units are answerable to their clients, the regulatory bodies or the end users on the predictions made by their models. In many scenarios, they need to ensure that the models are not biased towards certain features like gender, nationality, race etc.
Models that are math-heavy are not easily interpretable and work in black-boxes. As the complexitiy of the model increases, its interpretability reduces. At times, it becomes difficult even for the model creator to explain why the model has arrived at a particular decision.
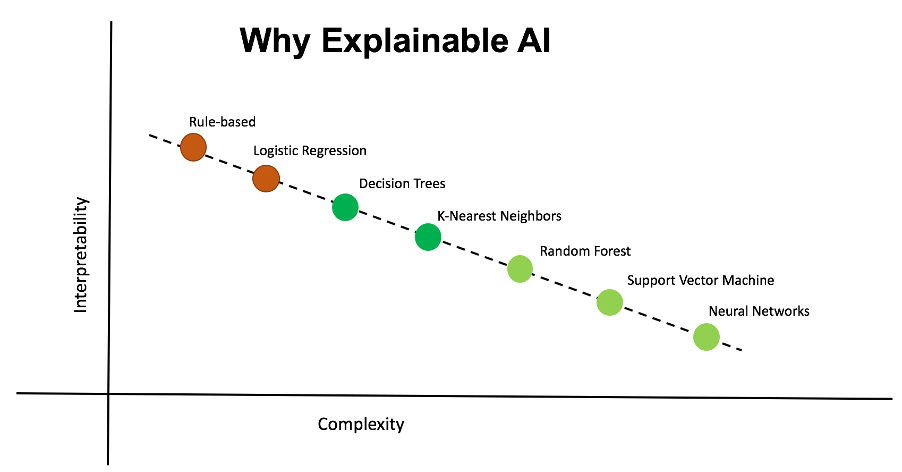
As the organizations start looking out for highly accurate and explainable models, the need for explainable AI is growing. Explainable AI provides a justification post-prediction.
XAI frameworks
There are many XAI frameworks available amongst which LIME & SHAP are the popular ones.
Refer to the article “Demystifying LIME (XAI) through Leaps” to get an in-depth understanding of how LIME works.
In this article we will try to understand how SHAP works internally to explain predictions and how to interpret its results.
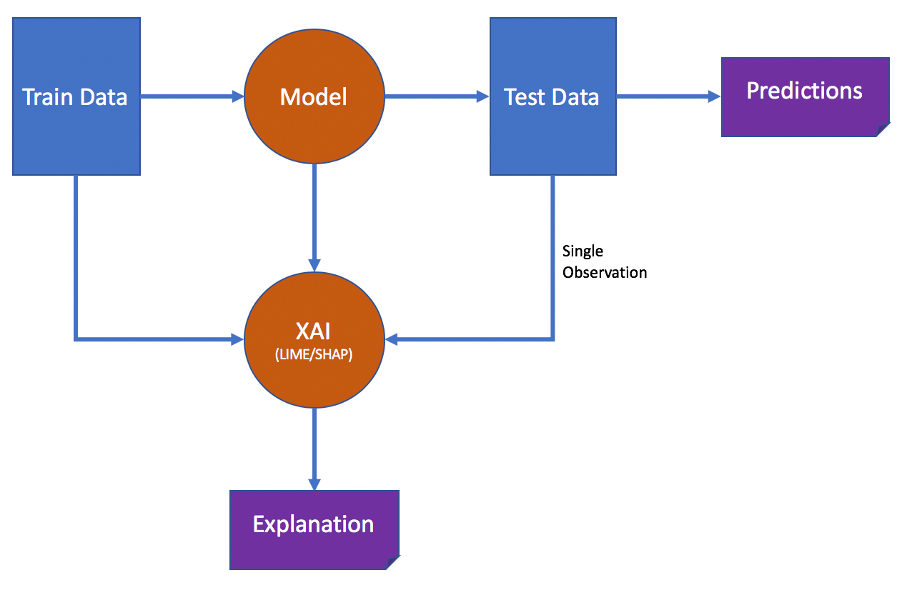
In a normal workflow, the model trains on the training dataset and then runs through the test data to make the predictions.
In order to provide an explanation, the XAI frameworks like LIME & SHAP use the training dataset along with the model to explain a particular prediction made on the test data.
What is SHAP?
SHAP stands for SHapley Additive exPlanations. Shap is an explainable AI framework derived from the shapley values of the game theory. This algorithm was first published in 2017 by Lundberg and Lee.
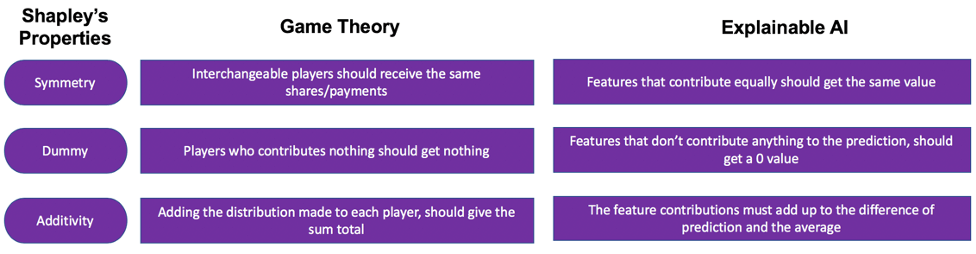
Shapley value can be defined as the average marginal contribution of a feature value over all possible coalitions.
Applying the Shapley’s properties of fairness from the game theory to explainable AI, the below comparison can be derived.
The below formula is used to derive the Shapley value for a feature.
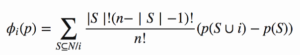
As shown in the formula, to get the Shapley value for a feature i, the marginal contribution of the feature [p(S U i) – p(S)] is calculated over all the subsets S.
In effect it means that the prediction made by the model is calculated for all the subsets with and without the feature and summed to get the Shapley value for that feature.
SHAP on LEAPS
Playing with SHAP without coding
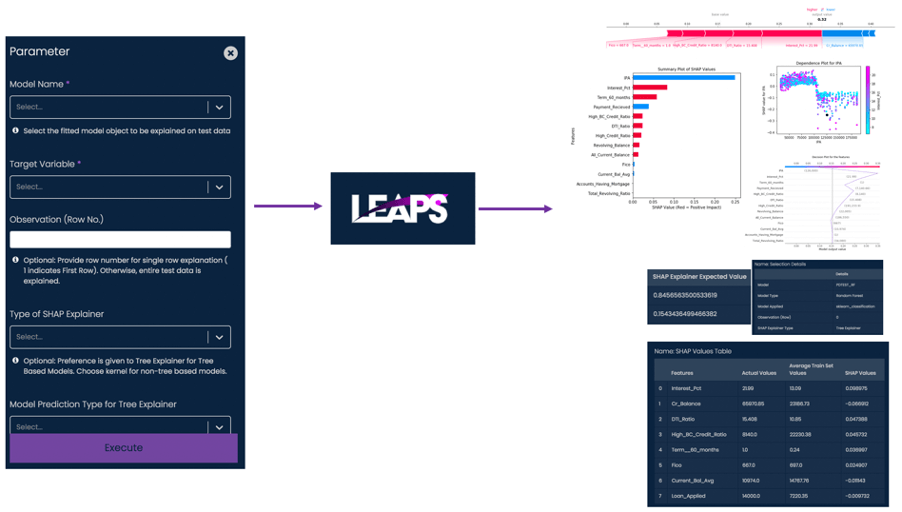
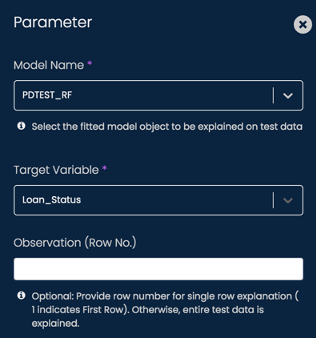
- SHAP can be run on Analyttica TreasureHunt® LEAPS platform as a point & click function
- SHAP results can be generated for either a single data point or on the complete dataset
- The plots & the output values from SHAP are recorded and available for the user to analyse & interpret
Explaining the results of SHAP
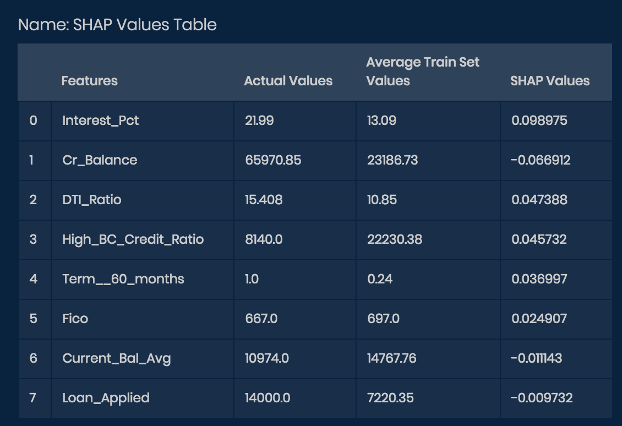
- Summing the SHAP Values totals to 0.166212
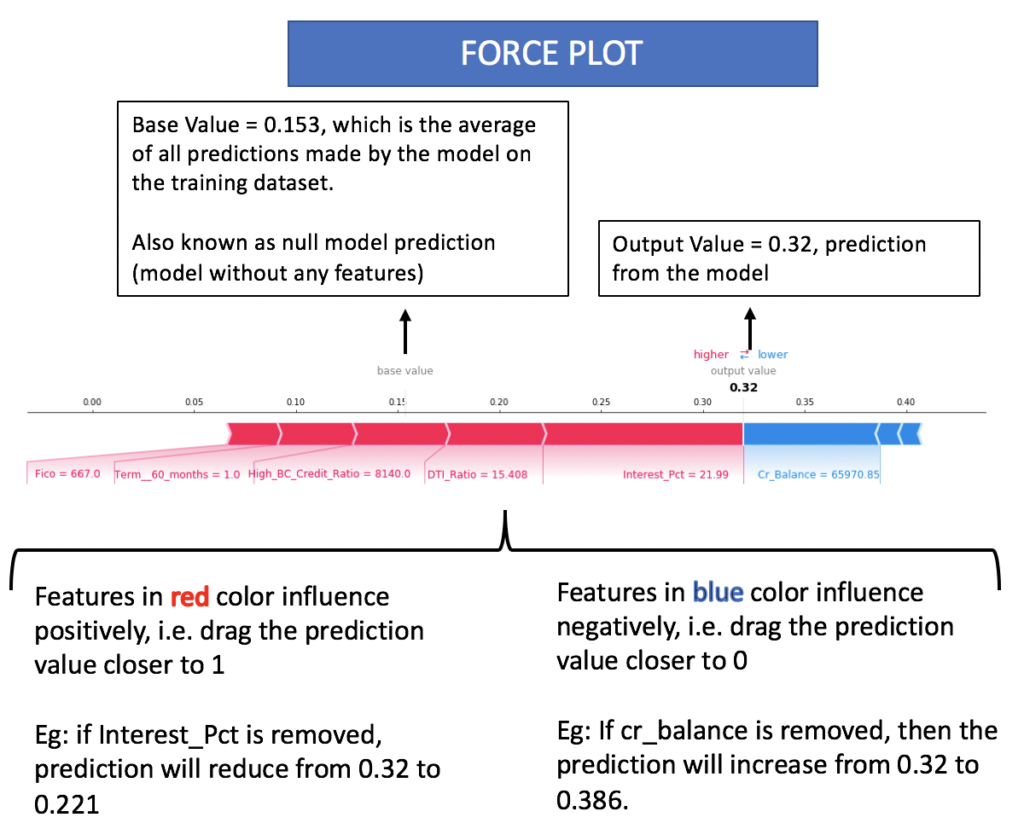
- This value of “0.166212” is the difference between the output value and the base value
- Output value is the prediction made by the model for the data point that has to be explained
- Base value is the average of all predictions on the training data
- Hence, for every feature, SHAP provides the contribution made by that feature in moving away from the base value or the average value.
- A positive SHAP value indicates that the feature has contributed in pushing the prediction towards 1 and a negative SHAP value indicates that the feature has contributed towards prediction of 0.
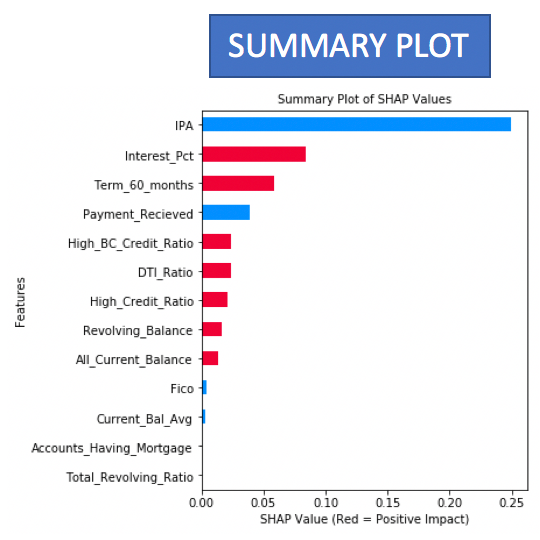
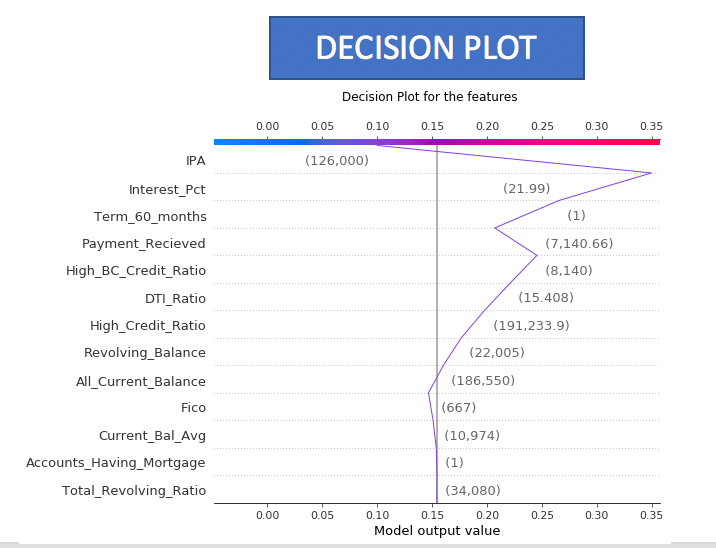
- The summary plots and the decision plots are few other ways to visualize the Shapley values of the features.
- The summary plot provides the list of features in the descending order of their importance
- The decision plot provides a visualization of how each feature has contributed in moving away or towards the base value.
Tuning SHAP
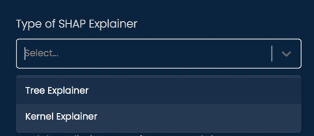
Choosing the right explainer
SHAP provides multiple explainers that can used based on the dataset and the model.
Some of the explainers currently supported by SHAP.
- Tree Explainer
- Kernel Explainer
- Deep Explainer
- Gradient Explainer
- Sampling Explainer
- Partition Explainer
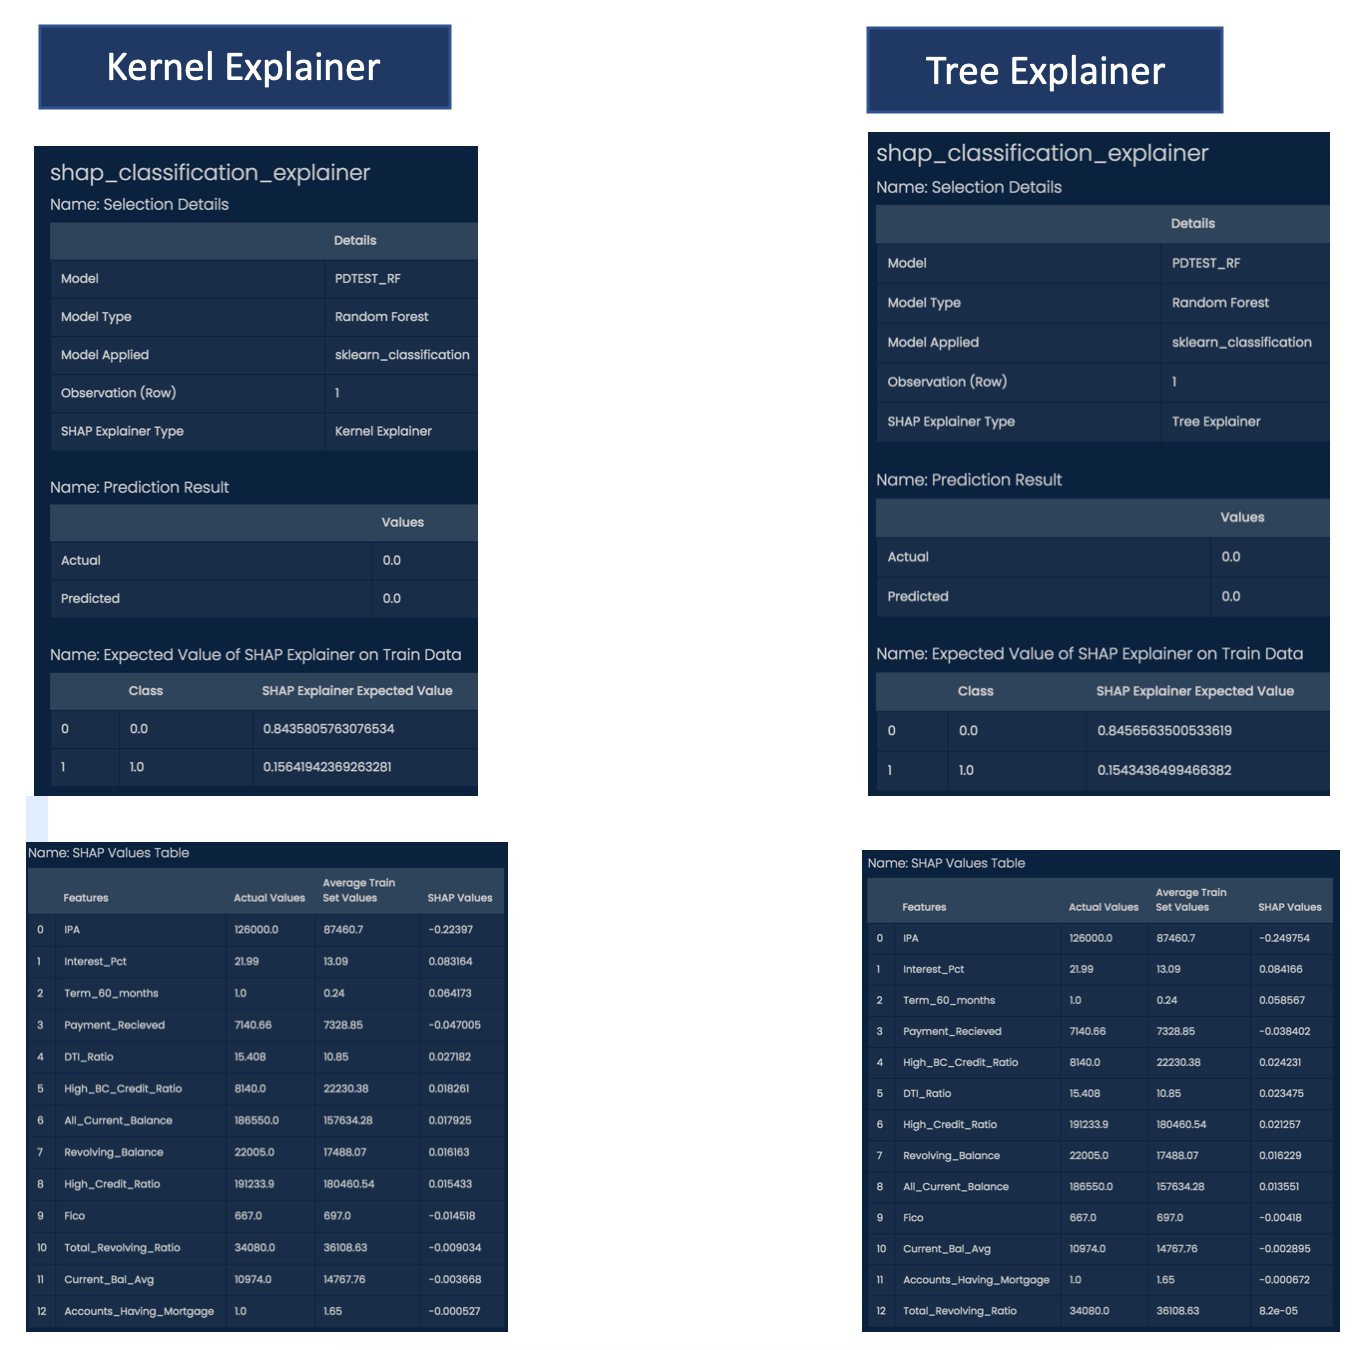
For tabular classification data, tree & kernel explainers are supported in LEAPS. By default, tree based models like decision cart, random forest, gradient boost will choose the tree explainer as it is more optimized for these models. For other types, the kernel explainer shall be picked by default.
Comparison between the results of Tree & Kernel explainers
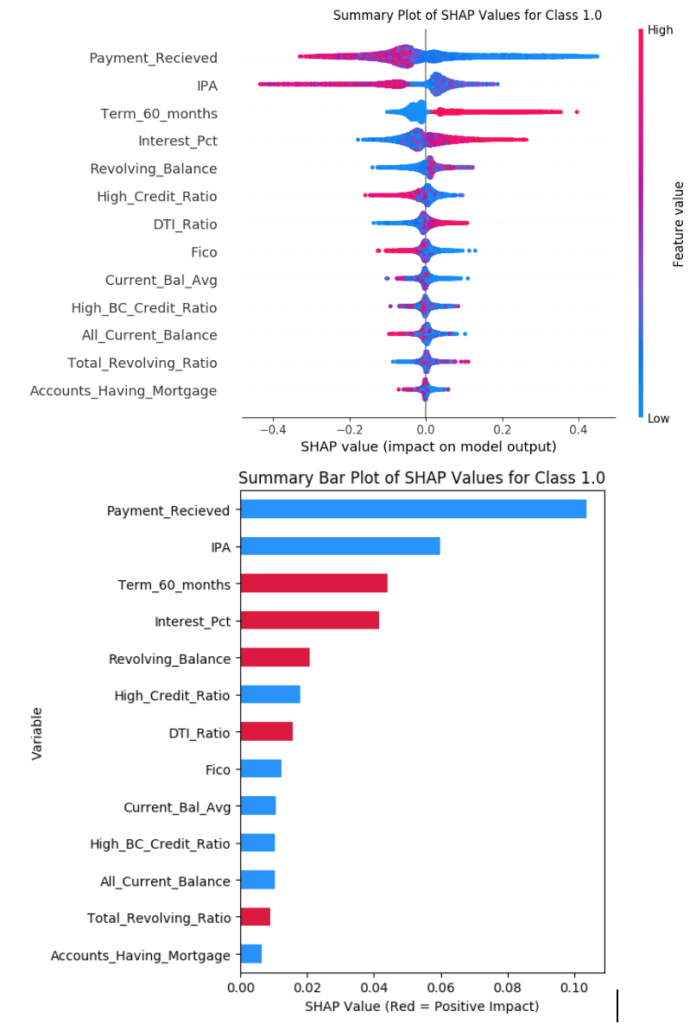
Global explanations with SHAP
Apart from being able to provide an explanation for a particular observation or data point, SHAP can also be used to explain on how the model behaves at a global level. For this the complete test data is used by SHAP to identify the most influencing features.
The graphs showing the feature importance at global level are plotted as below.
Red indicate a inclination towards class 1 and blue towards class 0.
Limitations of SHAP
- Computation Time: As the number of features increase, the number of possible combinations also increase leading to a higher computation time
- KernelSHAP ignores feature dependence. In case of correlated data, it is possible that it creates combinations that can never exist in real world.
- Shapley value can change with the order of features selected. Hence all possible comibinations must be considered.
Comparing LIME & SHAP
- Both LIME and SHAP are model-agnostic and can provide the explanation for any model.
- They build their own surrogate models and predict on it.
- They both treat models as black box. The explanations are provided on how the model behaves for different inputs around the data point, without getting into the internals of the model.
- LIME is faster as compared to SHAP as it can take some time for the Shapley values to be computed.
- Since SHAP uses all the subsets of the input data it is considered to have a better local accuracy and consistency.
Conclusion
SHAP provides a high consistency and local accuracy as it considers all possible combinations of input from the dataset to make predictions for an observation. Due to this it can get computationally heavy. The packages available (in R & Python) for SHAP are optimized with different explainers that make some approximations to improve the performance.
The results generated from SHAP can be used to identify the exact contribution made by each feature for a particular prediction, hence making it easy to explain to anyone.
Use the Analyttica TreasureHunt® LEAPS platform to create your own datacases, run the models and have an ability to explain the predictions.
Sources/References
https://christophm.github.io/interpretable-ml-book/shap.html
https://arxiv.org/abs/1705.07874
https://en.wikipedia.org/wiki/Explainable_artificial_intelligence